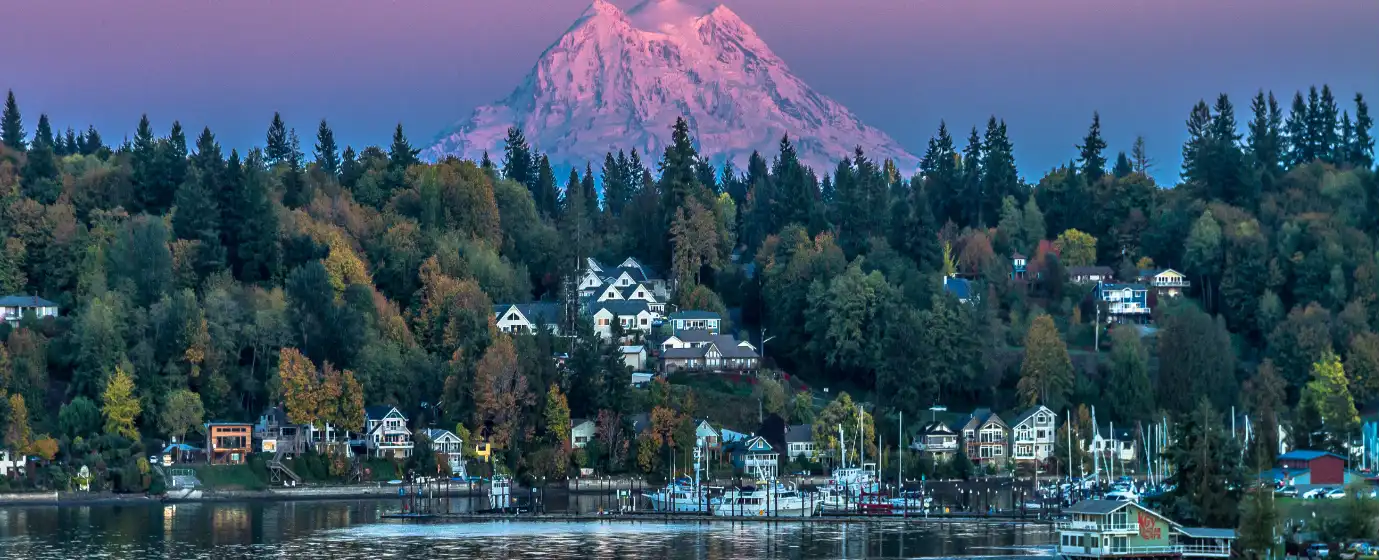
Puget Sound · Washington
Is Olympia Safe? Crime Rates, Safest Neighborhoods & Local Reality (2026)
Olympia carries a reputation that doesn't quite match what most buyers encounter after they move in. The city's raw crime statistics — pulled from FBI Uniform Crime Report data and amplified by aggregator sites — paint a picture that sends some relocating families straight to Lacey or Tumwater without a second look. The more nuanced reality is that Olympia's citywide averages are heavily skewed by a concentrated stretch of downtown activity and a daytime transient population inflated by state government foot traffic, advocacy services, and Capitol campus activity. That doesn't mean crime isn't real here — it is — but it means the numbers require context before they mean anything to a buyer choosing between a South Capitol craftsman and a Northwestside colonial.
On a typical day in most Olympia neighborhoods, crime is not something residents think about. Parents walk kids to school along tree-lined streets in Bigelow Highlands. Families bike the trail network near Watershed Park on weekends. Neighbors know each other by name in Cain Road and Governor Stevens. What separates the lived experience from the statistics is geography — and understanding which parts of the city pull the averages up is the most useful thing any buyer can learn before making an offer.
This guide breaks down what the numbers actually say, where they come from, which neighborhoods consistently rank among the safer pockets of the city, and what locals do in their daily lives that doesn't make it onto any crime map. Whether you're weighing Olympia against Tumwater or trying to decide which side of downtown to buy on, the information here will give you a clearer picture than any algorithm-generated score.
The first thing to understand about Olympia's crime data is that no two sources agree — and there's a legitimate reason for that. FBI Uniform Crime Report raw per-capita figures put Olympia's overall crime rate significantly above national and state averages, while block-group-weighted modeling tools like DoorProfit's 2026 methodology estimate the city's overall crime rate at roughly 26% below the national average. Both sets of numbers are drawn from the same underlying reported crime data, but they treat Olympia's dense downtown core and daytime-only Capitol population very differently. Buyers who only read one source are almost certainly getting a skewed picture.
Using FBI UCR figures for 2024, Olympia reported approximately 315 violent crimes and 1,916 property crimes — translating to roughly 564 violent incidents per 100,000 residents and approximately 3,435 property crimes per 100,000. Those figures sit notably above Washington state averages. At the same time, modeled estimates weight those incidents against actual residential population density by block group, producing a violent crime rate closer to 279 per 100,000 and a property crime rate near 1,763 per 100,000 — both of which land below or near the national average. The structural explanation for this gap is straightforward: the downtown corridor, which includes the Capitol campus, a concentration of social services, and a significant unhoused population, generates a disproportionate share of reported incidents relative to its residential population.
What drives property crime in particular is larceny-theft, which accounts for roughly 62% of all reported offenses citywide. Motor vehicle theft has historically been elevated, though auto theft dropped from approximately 303 cases in 2023 to 215 in 2024 — a meaningful improvement. Commercial areas near downtown and the 4th Avenue corridor contribute heavily to property crime totals, while residential neighborhoods farther from the core record far fewer incidents. Buyers looking at the citywide crime index as a proxy for neighborhood-level safety risk are essentially averaging a busy downtown bar district with a quiet cul-de-sac and treating the result as useful information.
Local police data suggests Olympia's violent crime rate — somewhere in the range of 3.4 per 1,000 residents when using residential population — places it above Washington's statewide average but in line with other mid-size capitals that double as regional service hubs. Practically speaking, most violent incidents are concentrated in the downtown core and adjacent transitional areas rather than in established residential neighborhoods. Aggravated assaults, which make up the largest share of violent crime, are not the kind of random stranger-violence that typically concerns families shopping in South Capitol or Northeast Olympia — they tend to cluster in areas with high foot traffic, late-night establishments, or social service concentrations.
Property crime is the more relevant concern for most buyers, and larceny-theft — not burglary or assault — is overwhelmingly what drives Olympia's numbers. It clusters along commercial corridors, in downtown parking areas, and near transit-adjacent blocks. Residential burglary figures have trended downward in recent years, with commercial burglaries also declining. The neighborhoods farthest from downtown, particularly those with active neighborhood associations and higher homeownership rates, typically see property crime rates that bear little resemblance to the citywide average.
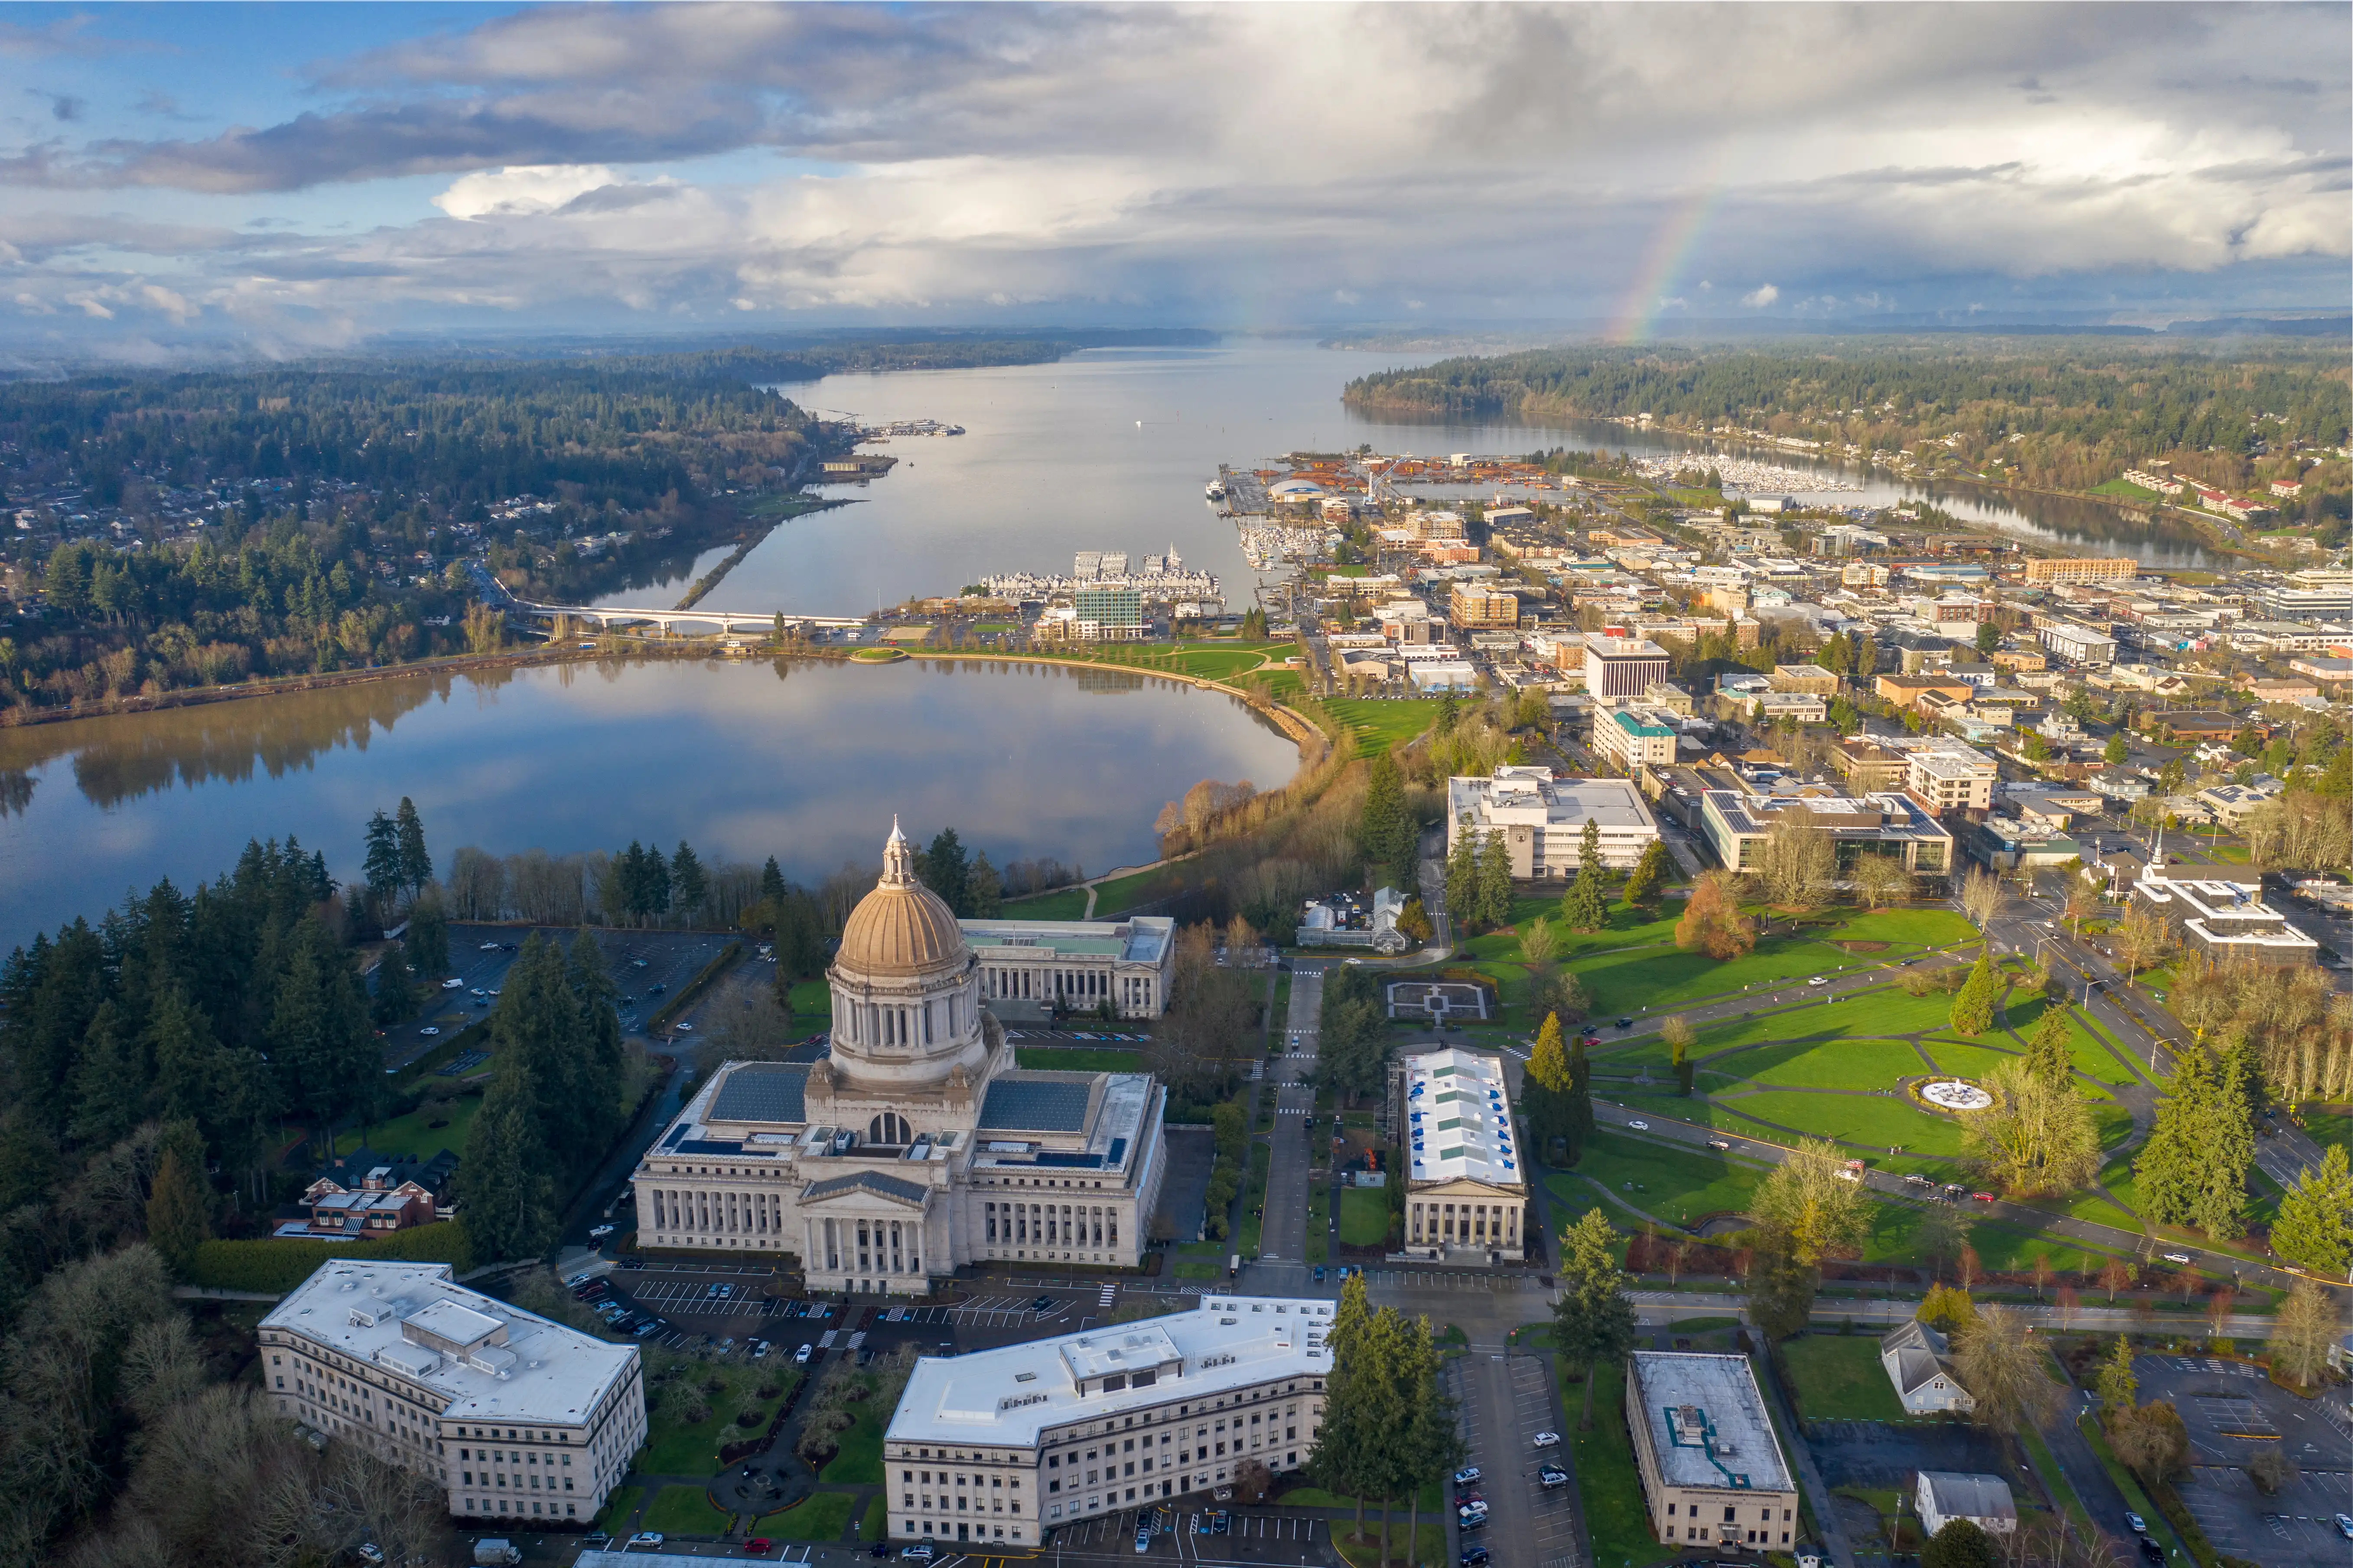
South Capitol is consistently one of the neighborhoods that surprises buyers who've read the city's headline statistics. The area runs roughly between Capitol Way and Jefferson Street, framing the south end of the Capitol campus, and it benefits from proximity to the seat of state government — heavy foot traffic from legislative staff, well-maintained streets, and an unusually active neighborhood association. Property crime here runs well below the city average, and the quiet, tree-lined blocks give it a character closer to a small New England college town than a Pacific Northwest state capital.
Best for: Buyers who want walkable access to downtown Olympia and Capitol Lake without the crime exposure of the urban core.
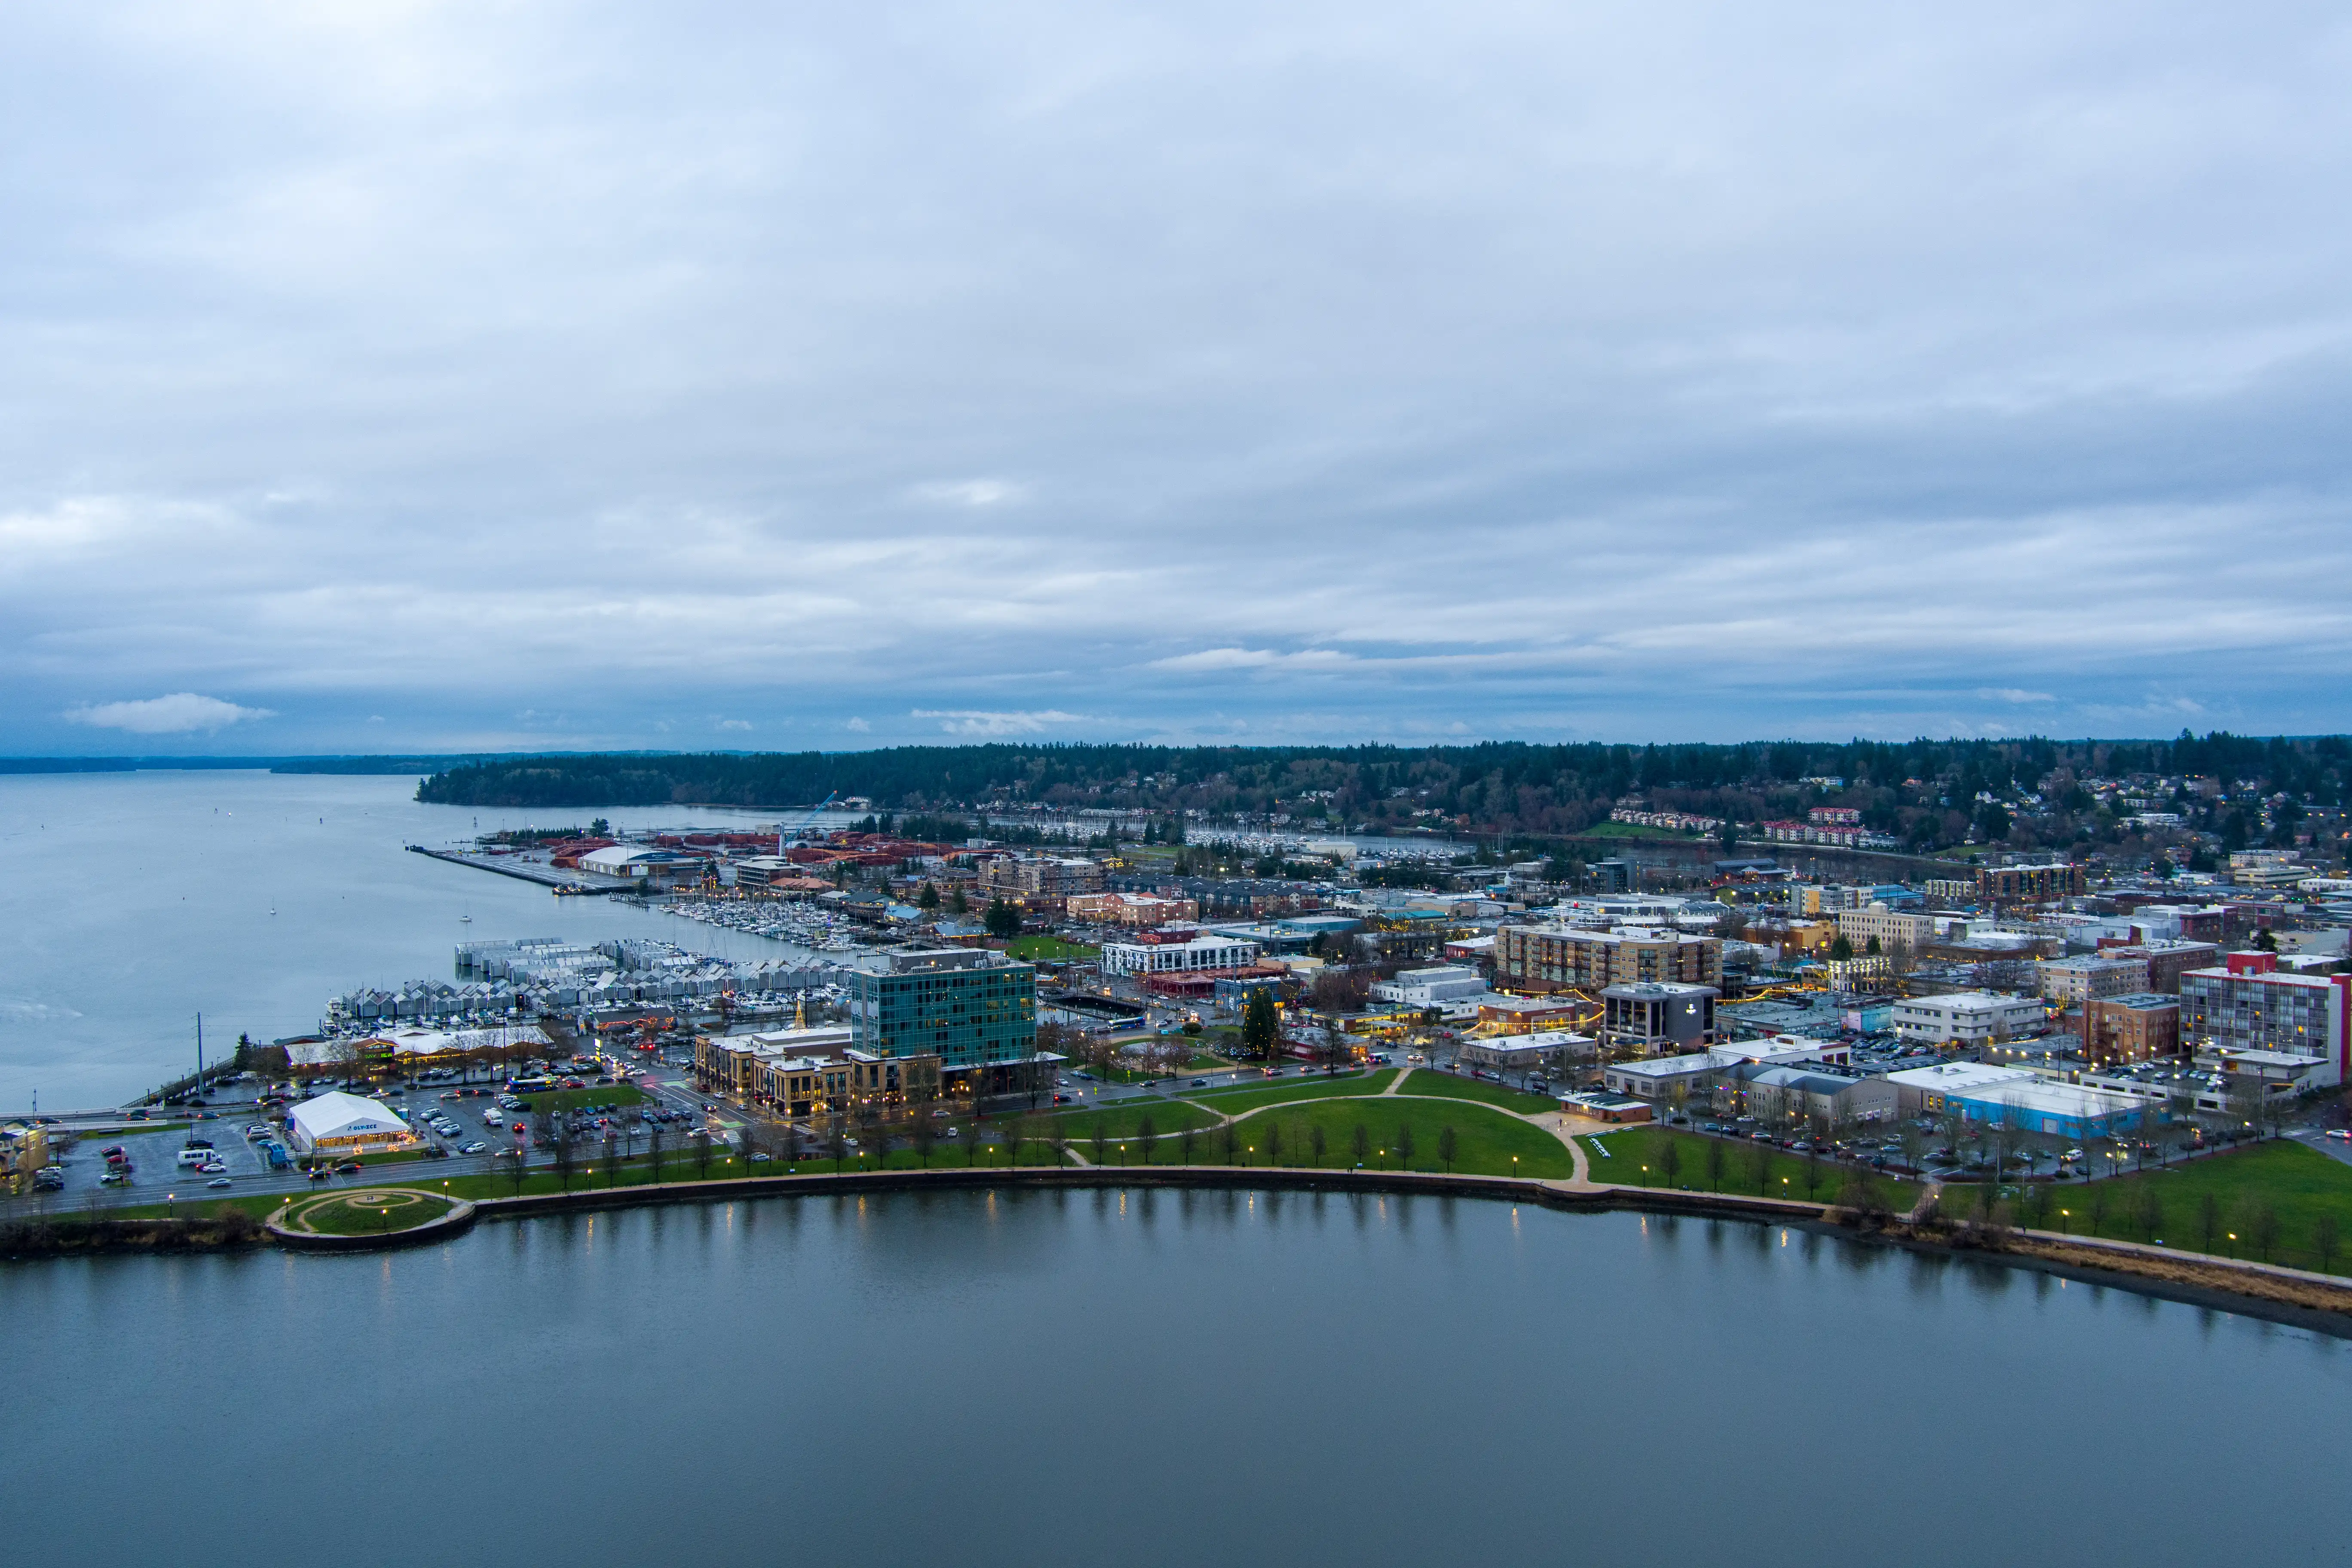
Downtown Olympia is where the city's crime statistics are most honestly earned. The area around 4th Avenue and Capitol Way, the blocks adjacent to Percival Landing, and the corridors near social service providers generate the bulk of the property crime incidents that pull up the citywide average. That doesn't make downtown unlivable — many residents genuinely love the walkability, the Farmers Market, the independent restaurant scene, and the access to the waterfront. But buyers need to go in with eyes open: car break-ins and petty theft are not rare occurrences here, and a second-floor condo with no dedicated parking requires real situational awareness.
Best for: Buyers who prioritize walkability and urban amenities over low crime exposure, and who understand the trade-off going in.
Northwest Olympia — the area generally bounded by Harrison Avenue to the south and extending toward Cooper Point Road — is one of the more consistently calm residential pockets in the city. The neighborhood skews toward homeowners with longer tenure, larger lots, and less commercial foot traffic than anything near the downtown core. Crime here is primarily limited to occasional property incidents, and the area's distance from transitional downtown corridors makes it one of the lower-exposure options for families who still want to stay within city limits.
Best for: Families with school-age children who want suburban quiet inside city limits.
Cain Road ranks among Olympia's safest residential areas by virtually every available metric. Block-group weighted data assigns it an A+ safety grade, with median household incomes around $122,000 reflecting a neighborhood that draws long-tenured homeowners with significant investment in the community. The area sits southeast of the urban core, insulated from downtown activity by distance and geography. Residents here tend to cite the neighborhood's strong sense of community and low turnover as primary reasons for staying long-term.
Best for: Buyers looking for one of Olympia's most statistically safe addresses in an established neighborhood with strong resale stability.
Bigelow Highlands sits northeast of downtown, running along the ridge above Budd Inlet, and it benefits from both elevation and neighborhood cohesion. The area is known locally for larger mid-century homes, mature trees, and a residents' association that takes community maintenance seriously. Crime exposure here is low relative to the city average — the neighborhood's residential density and lack of commercial activity keep it well off the radar of the property crime clusters that dominate the downtown and 4th Avenue numbers.
Best for: Buyers drawn to established, architecturally interesting homes with views and a strong sense of neighborhood identity.
East Bay Drive runs along the eastern shore of Budd Inlet and is consistently cited as one of Olympia's safer residential corridors. Waterfront homes here carry premium prices relative to the city's median — this is not a first-timer neighborhood — but the combination of natural geography, water views, and a relatively insulated residential character keeps crime exposure low. Block-group data places this corridor among the city's safer clusters, and the waterfront lifestyle attracts a stable, long-term ownership base.
Best for: Buyers seeking waterfront living with low crime exposure and are prepared for premium pricing above the city-wide median.

| City | Violent Crime / 1K | Property Crime / 1K | Overall Safety Profile |
|---|---|---|---|
| Olympia | ~3.4 | ~34 | Below WA average; heavily influenced by downtown core |
| Lacey | ~2.1 | ~28 | Notably safer overall; more suburban character |
| Tumwater | ~1.9 | ~22 | Among the safer South Sound cities; lower commercial density |
| Centralia | ~5.2 | ~52 | Higher crime across categories; regional service hub challenges |
| Shelton | ~4.1 | ~38 | Elevated rates; smaller city with fewer policing resources |
| Tacoma | ~6.8 | ~55 | Significantly higher; major urban center with concentrated crime pockets |
| Seattle | ~7.4 | ~62 | Among Washington's highest per-capita urban crime rates |

When buyers start researching safety in Olympia, they quickly notice that neighborhood choice has a real impact on long-term value, not just comfort. Areas like South Capitol and Northwest Olympia consistently attract strong buyer demand, and well-maintained homes there tend to move fast — sometimes within days of listing. Northeast Olympia also draws families who prioritize quieter streets and neighborhood stability. If you find a home you love in one of these areas priced under $600,000, assuming you have time to think it over can be a costly mistake.
Before you start touring homes, sit down with a lender first. Your approval amount and your comfortable monthly payment are two very different numbers, and the gap between them is where a lot of buyers get stretched thin. Your real payment includes property taxes, homeowner's insurance, any HOA dues, and the loan structure itself — all of which vary more than people expect in Olympia. Knowing your actual budget before you fall in love with a home puts you in a much stronger position when something good hits the market.
The blocks that locals instinctively avoid after dark are fairly predictable: the stretch of 4th Avenue between Capitol Way and Plum Street, the area immediately around the Transit Center on State Avenue, and the blocks near certain social service providers on the south end of downtown. These aren't secrets — longtime residents navigate them without drama, but they do navigate them with awareness. If you're looking at a home near those corridors, drive through at 9 PM on a Thursday, not just at 2 PM on a Saturday, before making your decision.
What the crime apps genuinely miss is how neighborhood-specific the experience is. NeighborhoodScout and similar tools aggregate at ZIP code level, which in Olympia means a single ZIP code can contain both a quiet residential block in South Capitol and a commercial strip with daily incident reports. Buyers who rely on those scores without drilling into neighborhood-level data consistently misread the market. The residents of Cain Road, Indian Creek, and Governor Stevens are not living in the same statistical environment as the downtown ZIP code suggests — and buying based on the wrong layer of data is one of the most common mistakes buyers make in this market.
What locals actually do is relatively low-key: don't leave anything visible in parked cars, particularly near Percival Landing or the 4th Avenue corridor. Know that the Farmers Market blocks on weekend mornings are among the most people-filled and inherently safe stretches of downtown. Check in with the neighborhood association of any home you're seriously considering — they'll tell you more in ten minutes than any aggregated score will tell you in a year of data.
Local Expert Takeaway: If you're drawn to Olympia but nervous about the headline crime numbers, concentrate your search on South Capitol, Bigelow Highlands, Cain Road, and the East Bay Drive corridor — these areas consistently record crime exposure well below the city average. Avoid drawing conclusions from any citywide score without first checking the block-group data for the specific address; the gap between Olympia's worst and best blocks is wider than almost any other South Sound city.
✅ Residential neighborhoods like Cain Road, Bigelow Highlands, and South Capitol consistently record crime well below Olympia's citywide average — and well below national averages in block-group-weighted data.
⚠️ Downtown Olympia — particularly the 4th Avenue corridor and blocks near the Transit Center — generates a disproportionate share of property crime incidents that pull up the city's overall statistics.
📍 Motor vehicle theft has trended down meaningfully since 2023, but car break-ins remain a real consideration near downtown parking areas and Percival Landing.
Is Olympia, WA a safe place to live?
It depends almost entirely on which part of Olympia you're asking about. Established residential neighborhoods in South Capitol, Bigelow Highlands, Cain Road, and Northwest Olympia record crime rates that are low by any regional comparison. The downtown core and adjacent transitional corridors are where the city's elevated statistics originate. Most residents who live in Olympia's quieter neighborhoods describe feeling safe and connected to their community.
What is the most common crime in Olympia?
Larceny-theft is by far the most common reported crime type, accounting for roughly 62% of all offenses citywide based on 2024 FBI data. It's concentrated in commercial areas, downtown parking zones, and transit-adjacent corridors rather than spread evenly across residential neighborhoods. Motor vehicle theft has been the second most notable category, though it declined significantly between 2023 and 2024.
How does Olympia compare to Lacey and Tumwater for safety?
Lacey and Tumwater both record lower crime rates than Olympia across violent and property categories. Tumwater in particular, with its more suburban and industrial character, tends to post some of the lowest per-capita crime figures in the South Sound. Buyers who prioritize crime metrics above walkability and neighborhood character often find that Lacey or Tumwater better fits their threshold — though they'll give up Olympia's Capitol-area access, established neighborhood architecture, and independent business district in the process.
Explore the full Olympia series: Living in Olympia · Is Olympia Safe? · Cost of Living · Best Neighborhoods · Schools & Family Life · Youth Sports · Parks & Rec · Retiring in Olympia