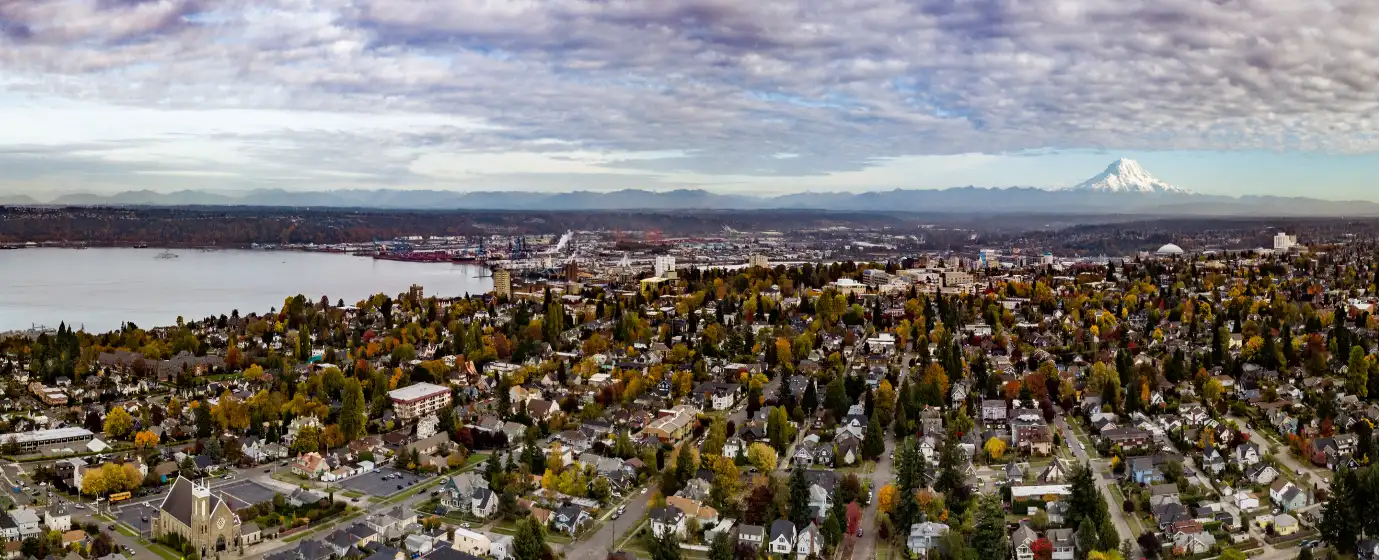
Puget Sound · Washington
Is Tacoma Safe? Crime Rates, Safest Neighborhoods & Local Reality (2026)
Tacoma has a reputation problem. Ask someone in Bellevue or Capitol Hill about it and you'll hear a version of the same hesitation — "isn't it kind of rough?" Ask someone who's actually lived there for a few years and you'll get a more complicated answer, one that involves specific corridors, directional shifts in recent data, and an honest acknowledgment that the city's crime numbers are real and shouldn't be dismissed. The truth sits somewhere between the fearful outsider narrative and the defensive local boosterism: Tacoma is a high-crime city by measurable standards, and it is also a city where hundreds of thousands of people live normal, safe daily lives — depending heavily on where they live within it.
The numbers matter here. FBI data for 2024 puts Tacoma's violent crime rate at roughly 7.4 per 1,000 residents and its property crime rate at approximately 55 per 1,000 — both significantly above national averages. But those figures are citywide averages that blend some of the safest residential pockets in Pierce County with corridors that account for a disproportionate share of incidents. A buyer who treats the citywide rate as their personal risk level is making the same mistake as someone who treats it as irrelevant. The real number that matters is the one tied to the specific block where you're considering buying.
This guide breaks down what Tacoma's crime data actually means for daily life, which neighborhoods consistently rank safer, what the city is doing about the hotspots, and what longtime residents know that no crime map app will tell you. If you're deciding whether Tacoma belongs on your shortlist — or which part of it does — read this before you make an offer.

The headline figures are stark, and there's no point softening them. FBI Uniform Crime Reporting data for 2024 places Tacoma's total crime rate at roughly 6,667 per 100,000 residents — more than double the national average. Property crime accounts for the bulk of that number, with larceny-theft alone making up over half of all reported incidents citywide. The statistic that tends to surprise people most is motor vehicle theft, which runs at approximately four times the national rate — a category that, while alarming on paper, is distinct from the kind of street violence that shapes whether a neighborhood feels livable day to day.
The more meaningful context is the direction of travel. Total reported crime fell roughly 23% between 2023 and 2024, with property crime down nearly 25% and violent crime declining about 14.5% over the same period. That isn't a rounding error or a data artifact — it reflects a real and measurable shift. Homicides dropped from a 2022 peak of 45 to 22 in 2024. The city's Violent Crime Reduction Plan, launched in partnership with researchers from the University of Texas San Antonio, deployed targeted hot-spot policing tactics and produced a 36% reduction in violent crime incidents in treated areas during the second half of 2024. Tacoma isn't fixed, but the trajectory is meaningfully different than it was three years ago.
What structurally drives the elevated numbers is worth understanding for any buyer. Tacoma's commercial density along corridors like Pacific Avenue and portions of South Tacoma Way concentrates foot traffic, transient activity, and retail crime in ways that inflate the citywide average. The city's significant port economy, active military presence at Joint Base Lewis-McChord, and a relatively high renter-to-owner ratio in certain districts all create conditions that criminologists associate with elevated property crime. Neighborhoods with higher homeownership rates, lower commercial density, and tighter block-level community cohesion — North End, Northeast Tacoma, Proctor District — consistently show crime profiles that look nothing like the citywide figures.
Tacoma's violent crime rate, commonly reported around 7.4 per 1,000 residents based on 2024 FBI data, sits well above the Washington state average. In practical terms, that rate is heavily concentrated in specific corridors — the Hilltop neighborhood, portions of the East 25th corridor, and stretches of the Central District bear a disproportionate share of the city's violent incidents. For the majority of Tacoma residents in its northern and northeastern neighborhoods, violent crime is not a daily presence — it's something they see in the news, not on their street. The 2024 data shows drive-by shootings down roughly 32% and business robberies down nearly 47% year-over-year in treated hot-spot zones, which suggests the reduction is genuine rather than statistical noise.
Property crime is the number that will most directly affect your life in Tacoma, regardless of where you live. Motor vehicle theft is the dominant concern — Tacoma's rate in this category runs four times the national average, and it is distributed more broadly across the city than violent crime. Locals in North End and Stadium District are not immune. What varies by neighborhood is the frequency of catalytic converter theft, package theft from porches, and break-ins targeting cars parked on-street overnight. Areas with less commercial foot traffic and more owner-occupied housing tend to see lower concentrations, but the baseline citywide risk is real and worth factoring into insurance decisions.
The North End is consistently one of Tacoma's safest residential areas, with crime rates that track closer to suburban Pierce County than to the citywide average. The neighborhood's character — large older homes, high owner-occupancy, tree canopy along North 30th and McCarver Street — creates the kind of street-level community presence that tends to suppress both property and violent crime organically. Residents here describe a neighborhood where package theft and the occasional car break-in are the realistic concerns, not anything more serious.
Best for: Buyers who want Tacoma's lowest crime exposure without sacrificing walkability to coffee shops and restaurants along the Proctor corridor.
Northeast Tacoma is the statistical outlier in this city — its violent crime rate runs roughly 76% below the citywide average, and it consistently earns a B- safety grade from aggregated national platforms. The geography helps: it's a largely residential peninsula bordered by water on multiple sides, with limited commercial thoroughfares that would attract transient activity. Proximity to Dash Point State Park gives it a genuinely suburban character. Many families with school-age children who need Tacoma's price points but want lower crime exposure land here.
Best for: Households with children who want the lowest crime profile within Tacoma city limits, with a trade-off of longer driving distances to downtown.
The Stadium District carries a slightly more urban risk profile than the North End, but remains among the calmer residential options in the city. Its position near downtown means some spillover from the commercial corridors, and occasional property crime incidents are more common here than in the far north. The neighborhood's density of renovated historic homes and engaged homeowners creates community watchfulness that keeps the numbers manageable. Street parking on the steeper blocks near the high school tends to be where auto break-ins concentrate, so garage-equipped properties have a measurable advantage.
Best for: Buyers who want walkable access to downtown Tacoma and can live with a slightly higher property crime baseline than North End.
Hilltop is where honest conversation matters most. It carries Tacoma's most elevated crime profile, and that reality should not be minimized for buyers considering the neighborhood's attractive Victorian housing stock and ongoing revitalization. The city's Violent Crime Reduction Plan has specifically targeted Hilltop hot spots, and the 2024 data shows measurable improvement — violent incidents in treated areas dropped sharply. But the baseline remains high, and the improvements are relatively recent. Buyers drawn to Hilltop's pricing and architecture should research specific blocks carefully, understand what "hot spot" boundaries look like in the current TPD data, and spend time in the neighborhood at different hours before committing.
Best for: Buyers who've done block-level research, understand the current risk profile, and are investing with a long horizon as the neighborhood continues its documented improvement trajectory.
Central Tacoma sits in the middle of the city's risk spectrum — neither the elevated concern of Hilltop nor the relative calm of the North End. The neighborhood's crime index ranges widely depending on proximity to Pacific Avenue, which functions as a commercial and foot-traffic corridor with associated property crime activity. Residents who live on residential side streets report a different experience than those on or adjacent to Pacific itself. The key practical precaution locals follow here is simple: secure vehicles in a garage or driveway whenever possible, and don't leave anything visible in a parked car.
Best for: Buyers who prioritize central location and price point over crime profile, with eyes open to the property crime baseline.
The South End encompasses a wide geographic area with meaningful internal variation. Neighborhoods closer to Steilacoom Boulevard and the 72nd Street corridor tend to read calmer than areas nearer South Tacoma Way, where commercial density and transit activity drive higher property crime rates. Fern Hill, which sits within the broader South End geography, is among the more settled residential pockets with lower incident concentrations. The practical reality for buyers here is that the South End requires the most granular block-level research of any area in the city — general neighborhood-level data masks significant variation.
Best for: Buyers willing to do block-level research who need lower price points and are comfortable with a moderate property crime baseline.
| City | Violent Crime/1K | Property Crime/1K | Overall Safety Profile |
|---|---|---|---|
| Tacoma | ~7.4 | ~55 | High crime city; large internal variation by neighborhood |
| Lakewood | ~5.2 | ~45 | Elevated; some commercial corridor concentration |
| Puyallup | ~3.8 | ~32 | Moderate; lower than Tacoma citywide average |
| University Place | ~2.1 | ~22 | Among the safer options adjacent to Tacoma |
| Federal Way | ~5.6 | ~47 | Elevated; comparable to Lakewood |
| Fircrest | ~1.4 | ~18 | Consistently low; small residential city |
| Seattle | ~8.1 | ~58 | Comparable or higher to Tacoma in several categories |

When clients ask me about buying in Tacoma, the neighborhood conversation matters more than people realize — especially for long-term value. Areas like the North End, Proctor District, and Stadium District consistently draw strong buyer interest because of their stability, walkability, and community feel. Homes in these neighborhoods, many priced under $750,000, tend to move quickly once listed. If you find a pocket you love, you won't have weeks to think it over.
That's exactly why I encourage buyers to talk with a lender before they start touring homes. Your approval amount and your comfortable budget are two different numbers, and the gap between them becomes real once you factor in property taxes, homeowner's insurance, any HOA dues, and how your loan is structured. I've seen buyers fall in love with a home only to feel stretched once the full monthly picture came into focus. Knowing what you're genuinely comfortable with ahead of time means you can move confidently when the right home in the right neighborhood shows up.
The crime apps give you polygons. Locals navigate by corridors and time of day. Pacific Avenue south of downtown is a different street at 2 p.m. than it is at midnight, and residents who've been in Tacoma for years adjust their patterns accordingly without much conscious thought. The East 25th corridor has been one of the city's designated VCRP hot spot zones — it's a stretch most North End and Stadium District residents simply don't pass through regularly. Understanding which corridors to be situationally aware on is more useful than memorizing citywide statistics.
Motor vehicle theft is the crime most likely to directly affect you in Tacoma, regardless of which neighborhood you buy in. Locals with garages use them — this is not a place to treat a garage as extra storage and park on the street by default. Catalytic converter theft peaked city-wide a few years ago and has moderated somewhat, but Tacoma still runs well above national rates in this category. The practical adaptation most longtime residents have made is straightforward: comprehensive auto insurance, garage parking where available, and never leaving a visible item in a parked car on any commercial-adjacent street.
What the crime maps won't show you is that TPD's staffing situation is a real constraint. The department has been operating below its historical peak staffing levels, with 28 vacant positions reported in 2025 and an ongoing lateral hiring incentive program — a $50,000 bonus for experienced officers — designed to address it. Slower response times to property crime calls are a documented reality. Neighbors in the calmer residential areas of North End and Northeast Tacoma often point to block-level familiarity and community communication apps as the practical first line of awareness, not police response. That's not a failure of the city — it's how community safety has always actually worked in most residential neighborhoods.
Local Expert Takeaway: The buyers who make the best decisions in Tacoma are the ones who skip the citywide grade and go straight to the block-level incident map for the specific property they're considering. Northeast Tacoma and North End consistently show crime profiles that would not embarrass any Puget Sound suburb — while sitting at price points $150,000 to $200,000 below comparable University Place inventory. If you're weighing Tacoma against its neighbors, run the block-level data before you dismiss it based on the headline number.
✅ Tacoma's crime numbers are improving — violent crime fell roughly 14.5% in 2024 vs. 2023, and homicides dropped from a 2022 peak of 45 to 22 in 2024. The trajectory is real.
⚠️ Property crime — especially auto theft — affects all neighborhoods. Regardless of where you buy in Tacoma, a garage and comprehensive auto coverage are practical necessities, not upgrades.
📍 Location within Tacoma matters more than the citywide average. The gap between Northeast Tacoma (one of Washington's calmer residential areas) and the central hot-spot corridors is enormous — treat them as different cities when evaluating your risk.
Is Tacoma a safe place to live?
Tacoma is safer in some neighborhoods than its reputation suggests, and genuinely elevated in others. The citywide crime rate is above national averages, but Northeast Tacoma, North End, and Proctor District consistently show crime profiles that compare favorably to neighboring Pierce County cities. The most accurate answer is: it depends on where specifically you're buying.
What is the crime rate in Tacoma?
Based on 2024 FBI data, Tacoma's violent crime rate runs approximately 7.4 per 1,000 residents and property crime at roughly 55 per 1,000. Both figures are above Washington state and national averages, though both declined meaningfully from 2023 to 2024. Motor vehicle theft is the most elevated category relative to national benchmarks.
How does Tacoma compare to nearby cities for safety?
Tacoma's citywide crime rates run higher than Puyallup, University Place, and Fircrest — all neighboring communities with notably lower incident rates. Lakewood and Federal Way are broadly comparable to Tacoma, while Seattle's citywide figures in several crime categories actually approach or exceed Tacoma's. Buyers choosing between Tacoma and its neighbors should weigh that comparison against the significant home price differences involved.
Explore the full Tacoma series: Living in Tacoma · Is Tacoma Safe? · Cost of Living · Best Neighborhoods · Schools & Family Life · Youth Sports · Parks & Rec · Retiring in Tacoma